
Focus: Data Visualization / Geospatial Analysis / Sentencing Statistics
Project Objective: To consolidate dispersed arrest data from multiple districts into a coherent spatial narrative, documenting the legal impact on 417 defendants.
Methodology: Quantitative synthesis of court records; localized Geospatial Mapping to define arrest zones; and statistical visualization via donut charts and sentencing bars.
Key Expertise: Advanced Data Visualization, Spatial Information Design, and high-density content architecture.
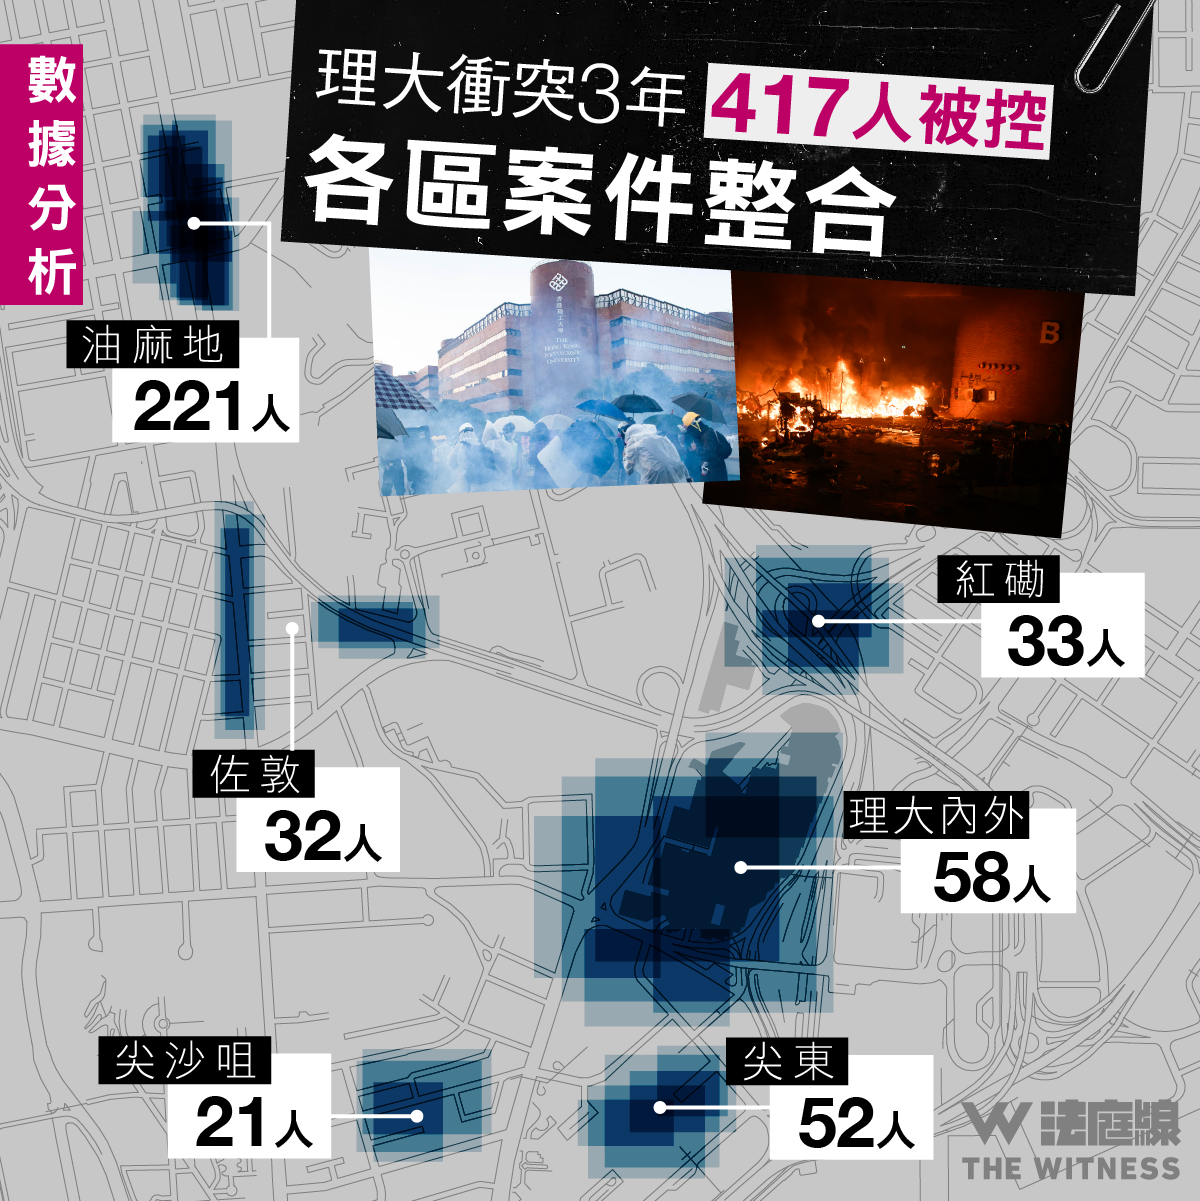
(Left) Macro Arrest Mapping: An integrated overview mapping arrest clusters across major conflict zones. The visualization highlights PolyU as the largest spatial perimeter, while Yau Ma Tei recorded the highest density of 221 defendants.
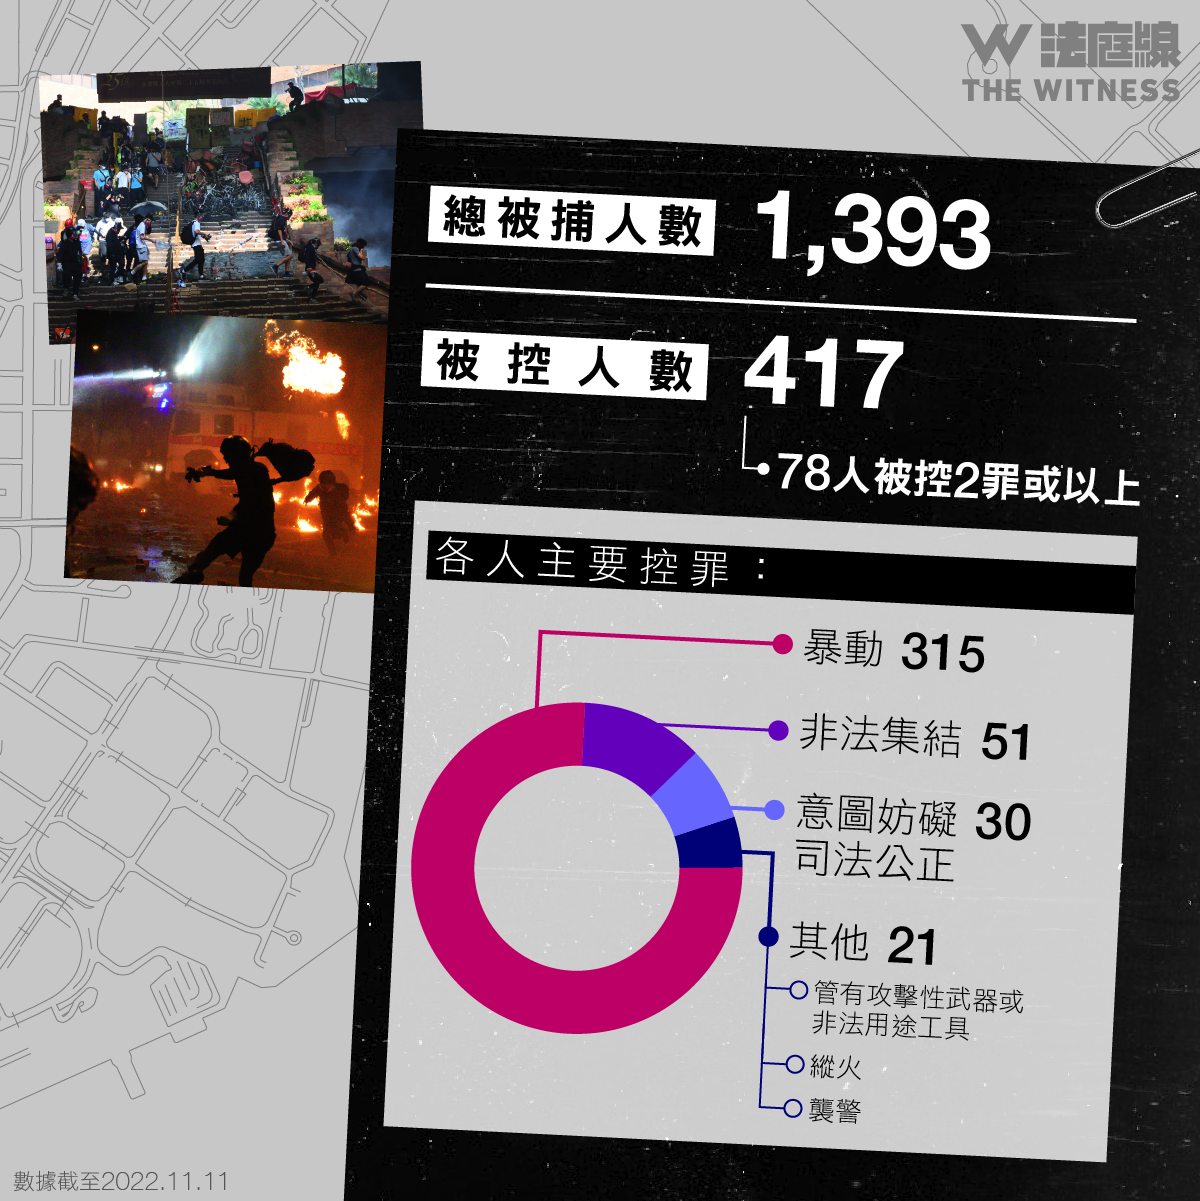
(Right) Statistical Charge Breakdown: A donut chart illustrating the distribution of charges among 417 individuals; rioting (315) emerges as the predominant legal charge.
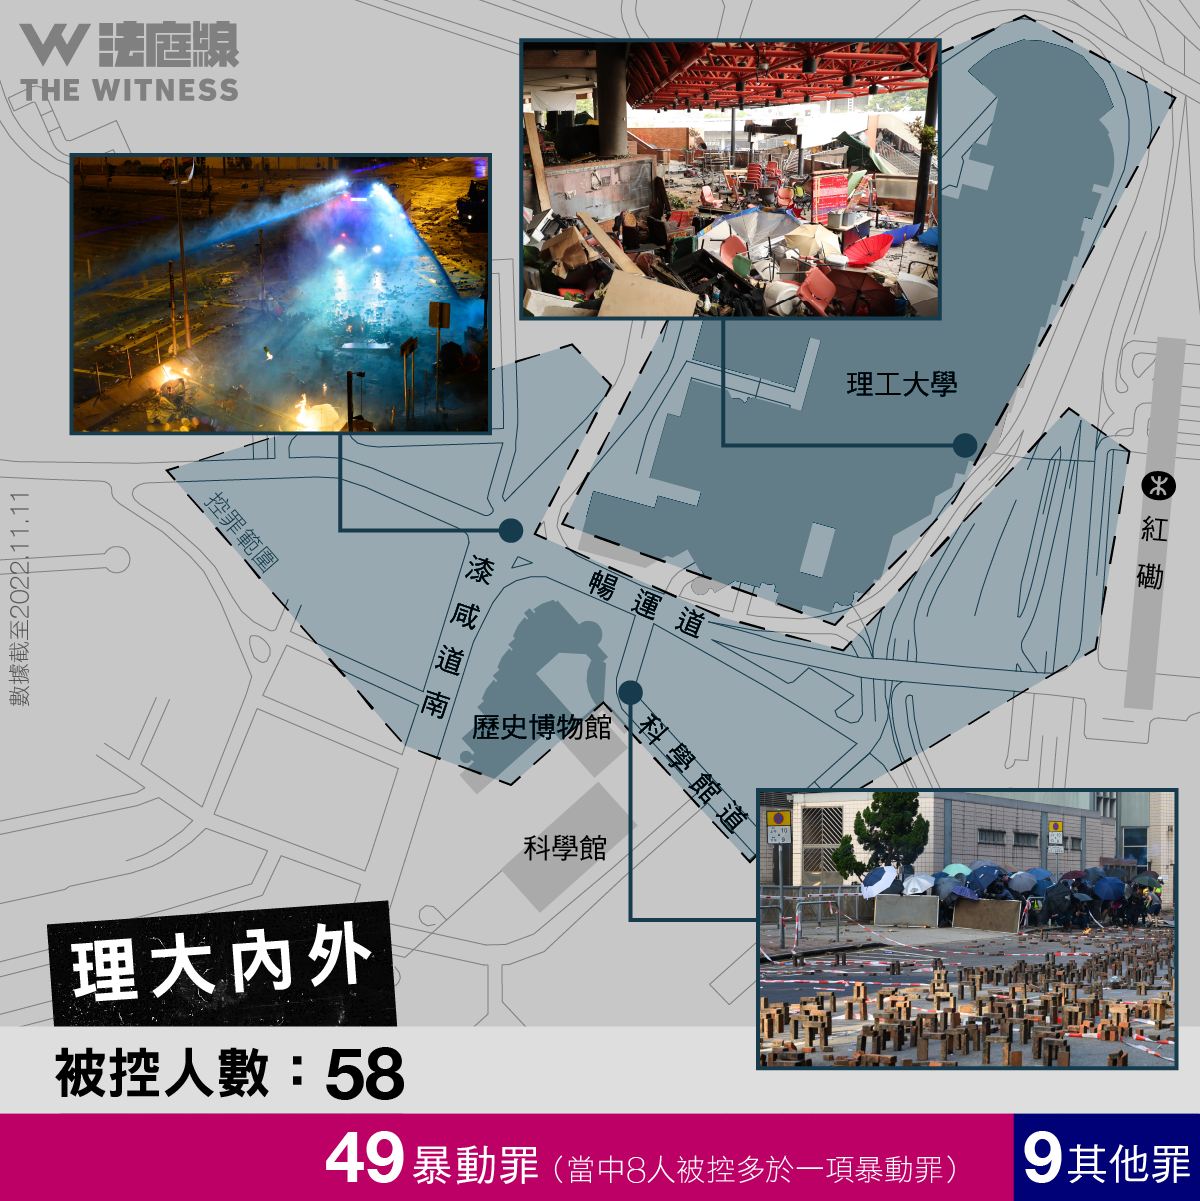
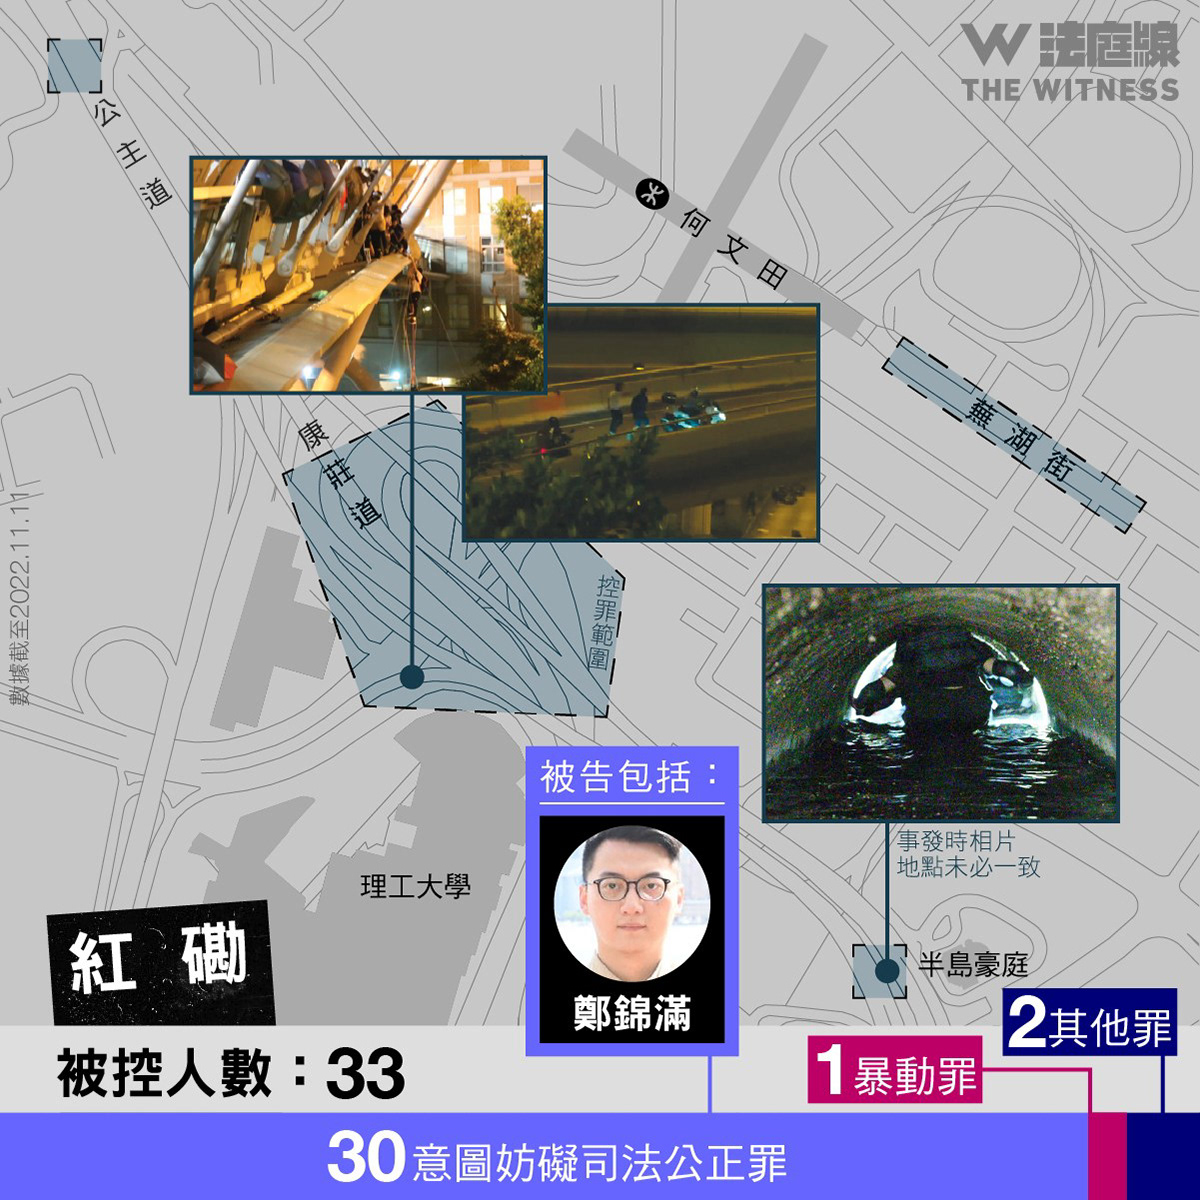
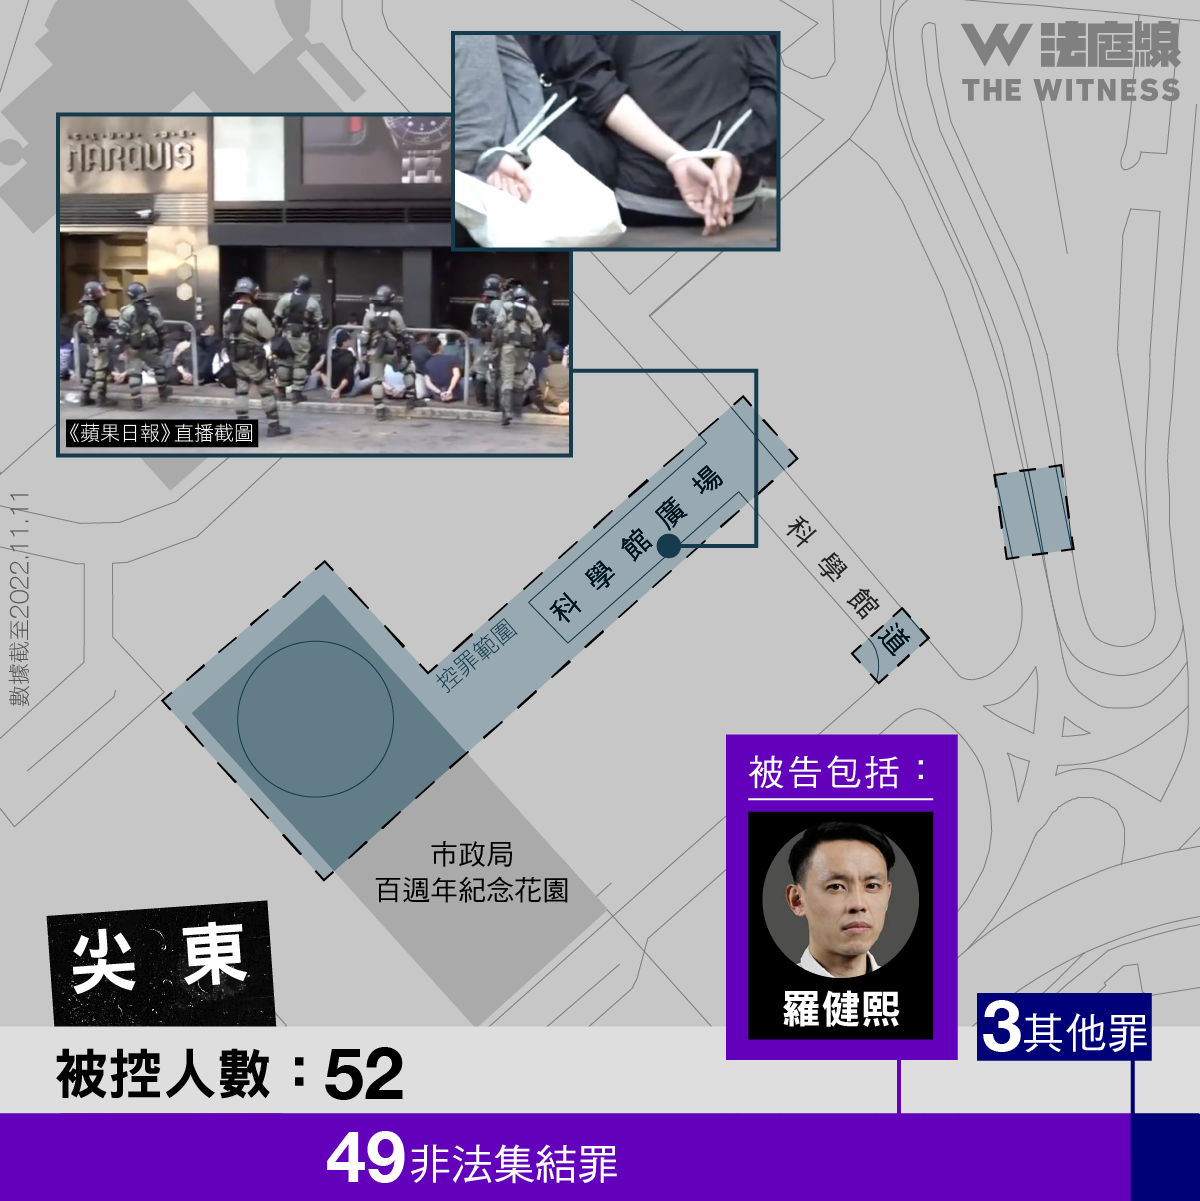
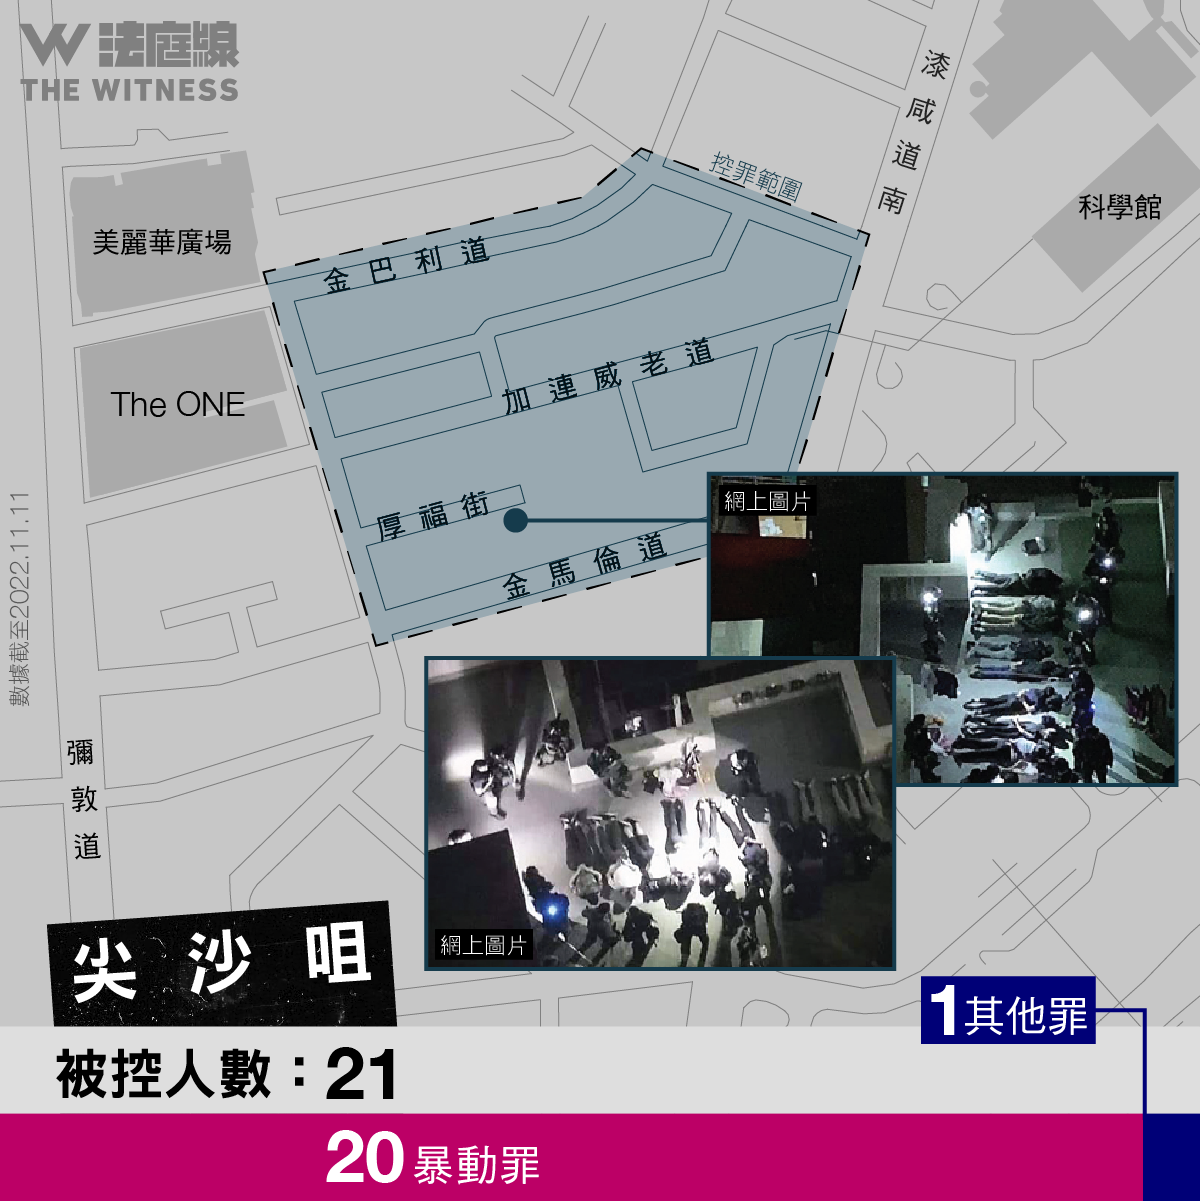
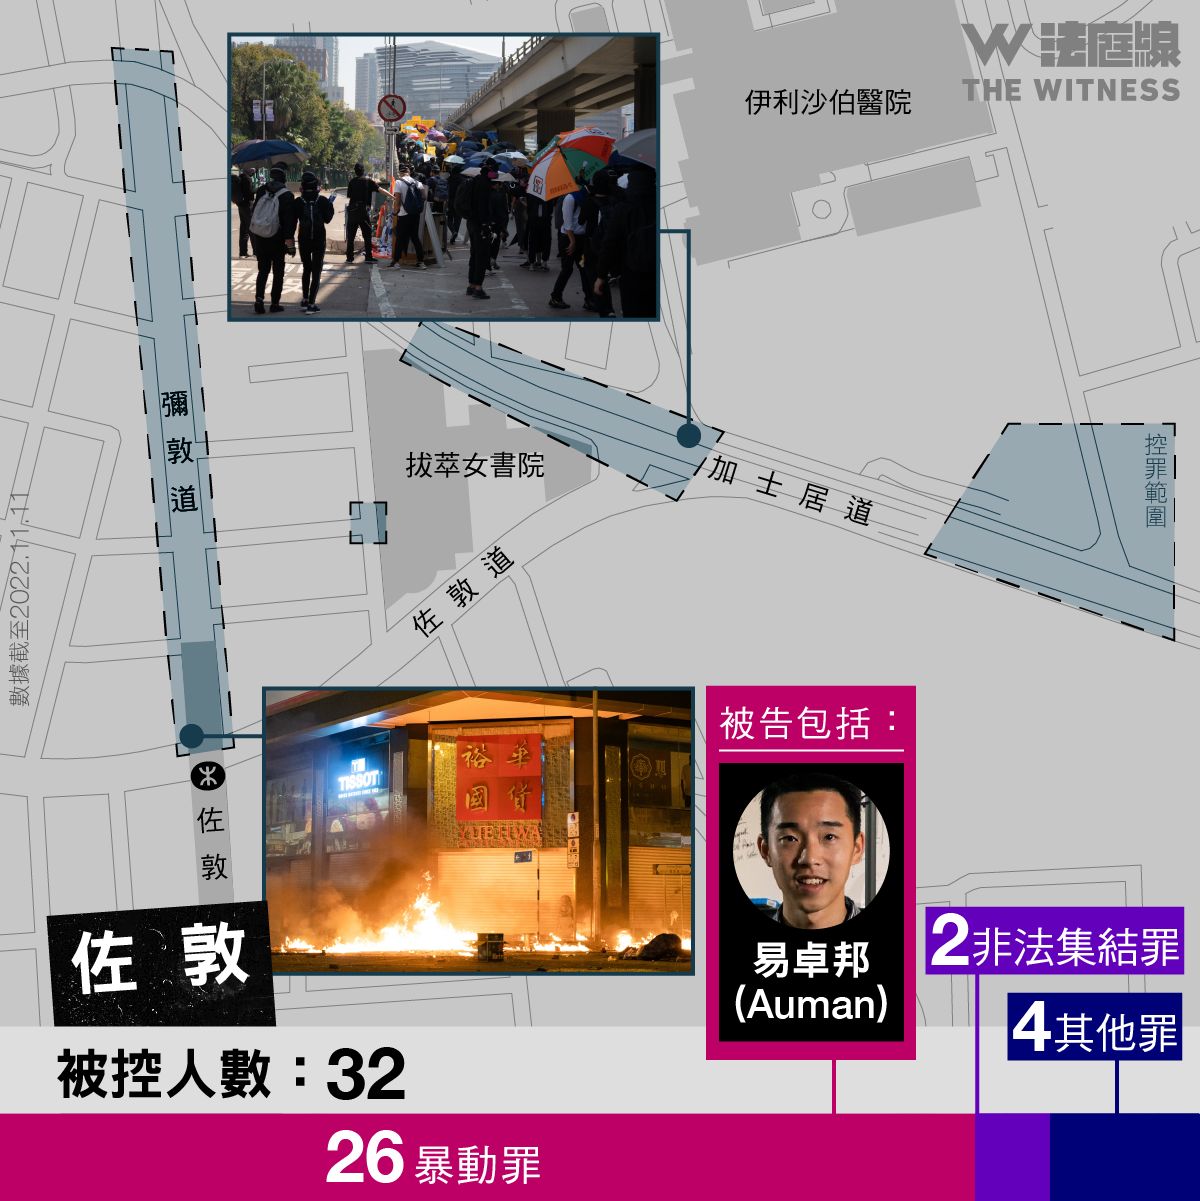
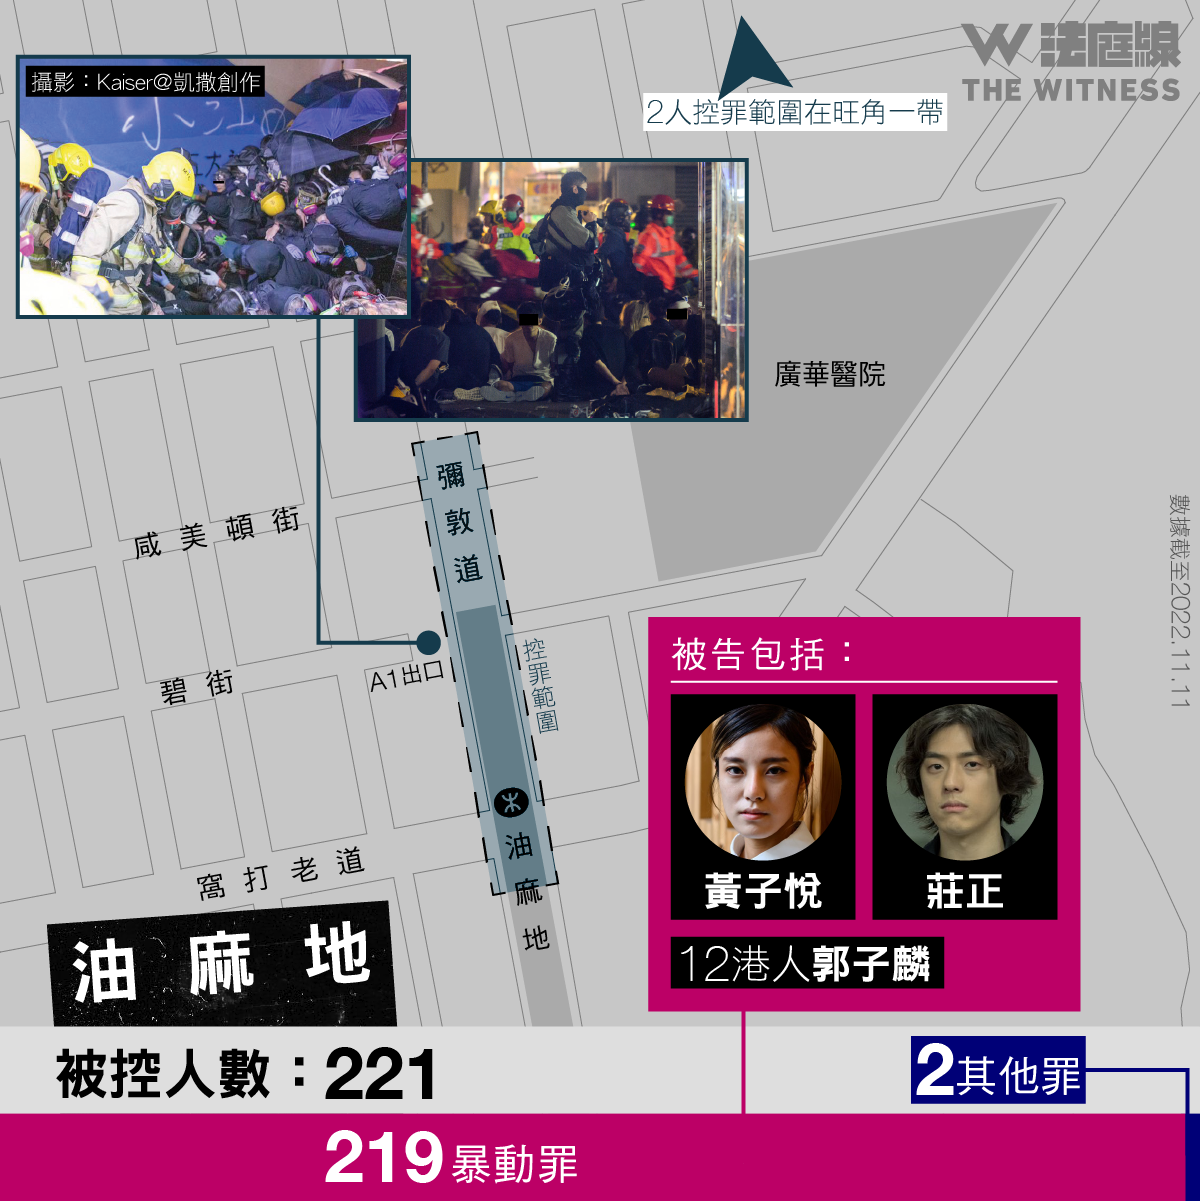
Localized Zone Analysis (PolyU, Hung Hom, TST East, TST, Jordan, Yau Ma Tei):
A series of localized "deep-dive" maps zooming into specific districts. These charts precisely define the legal boundaries of arrest zones, specific charge counts per area, and key trial demographics.
A series of localized "deep-dive" maps zooming into specific districts. These charts precisely define the legal boundaries of arrest zones, specific charge counts per area, and key trial demographics.
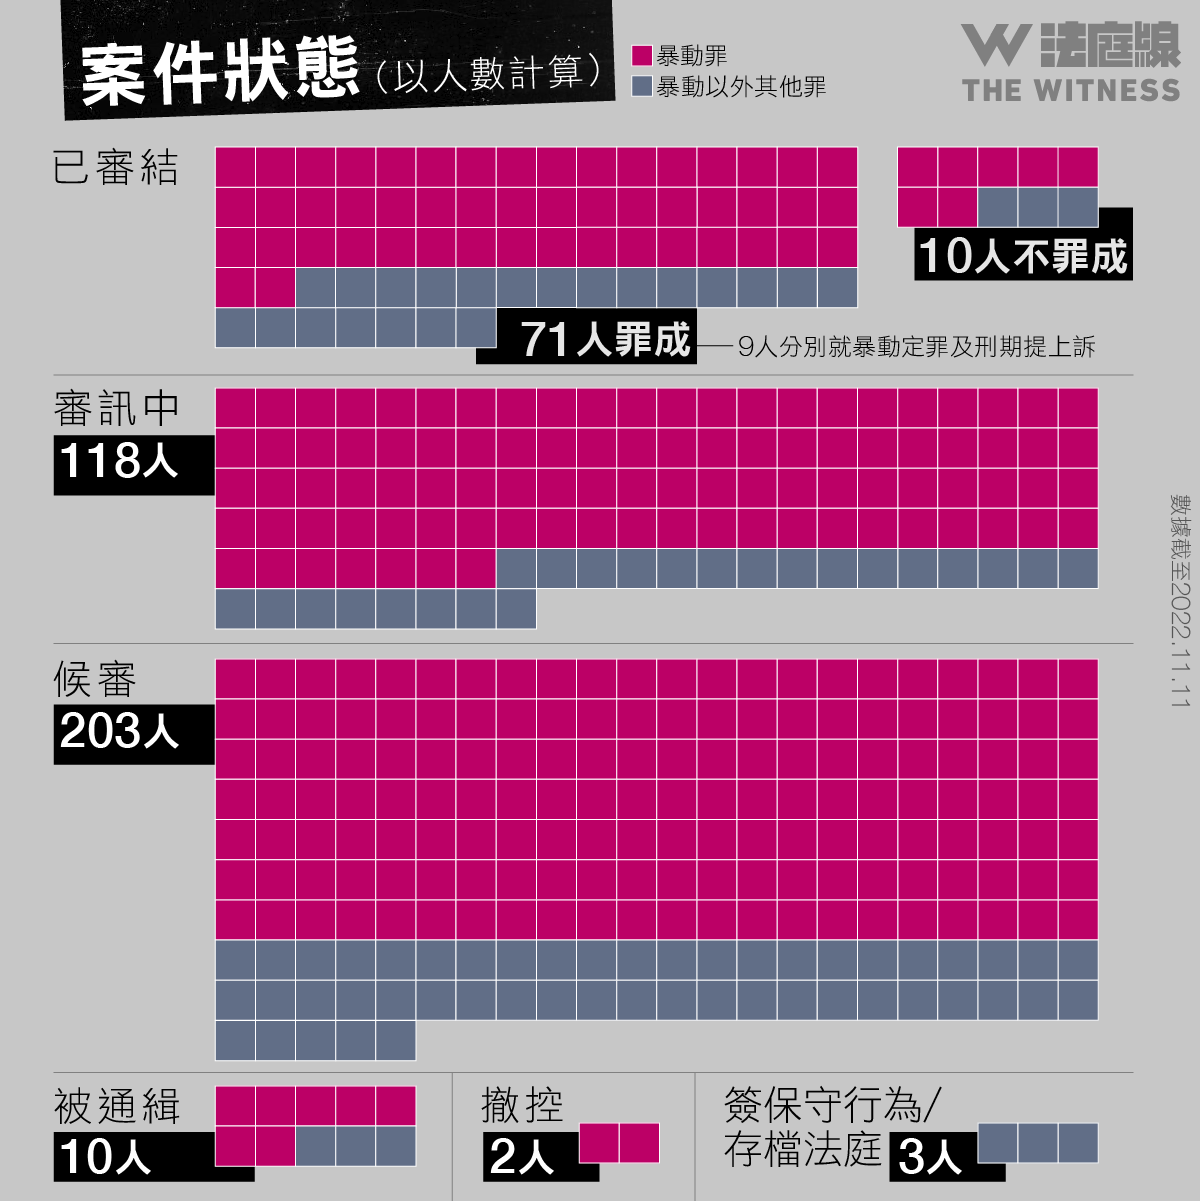
(Left) Judicial Status Matrix: A unit-grid visualization (1 square = 1 person) mapping judicial progress. Hot pink denotes rioting charges, while blueish-grey represents other offenses. The data reveals a high prevalence of rioting charges and a significant backlog of cases awaiting trial.
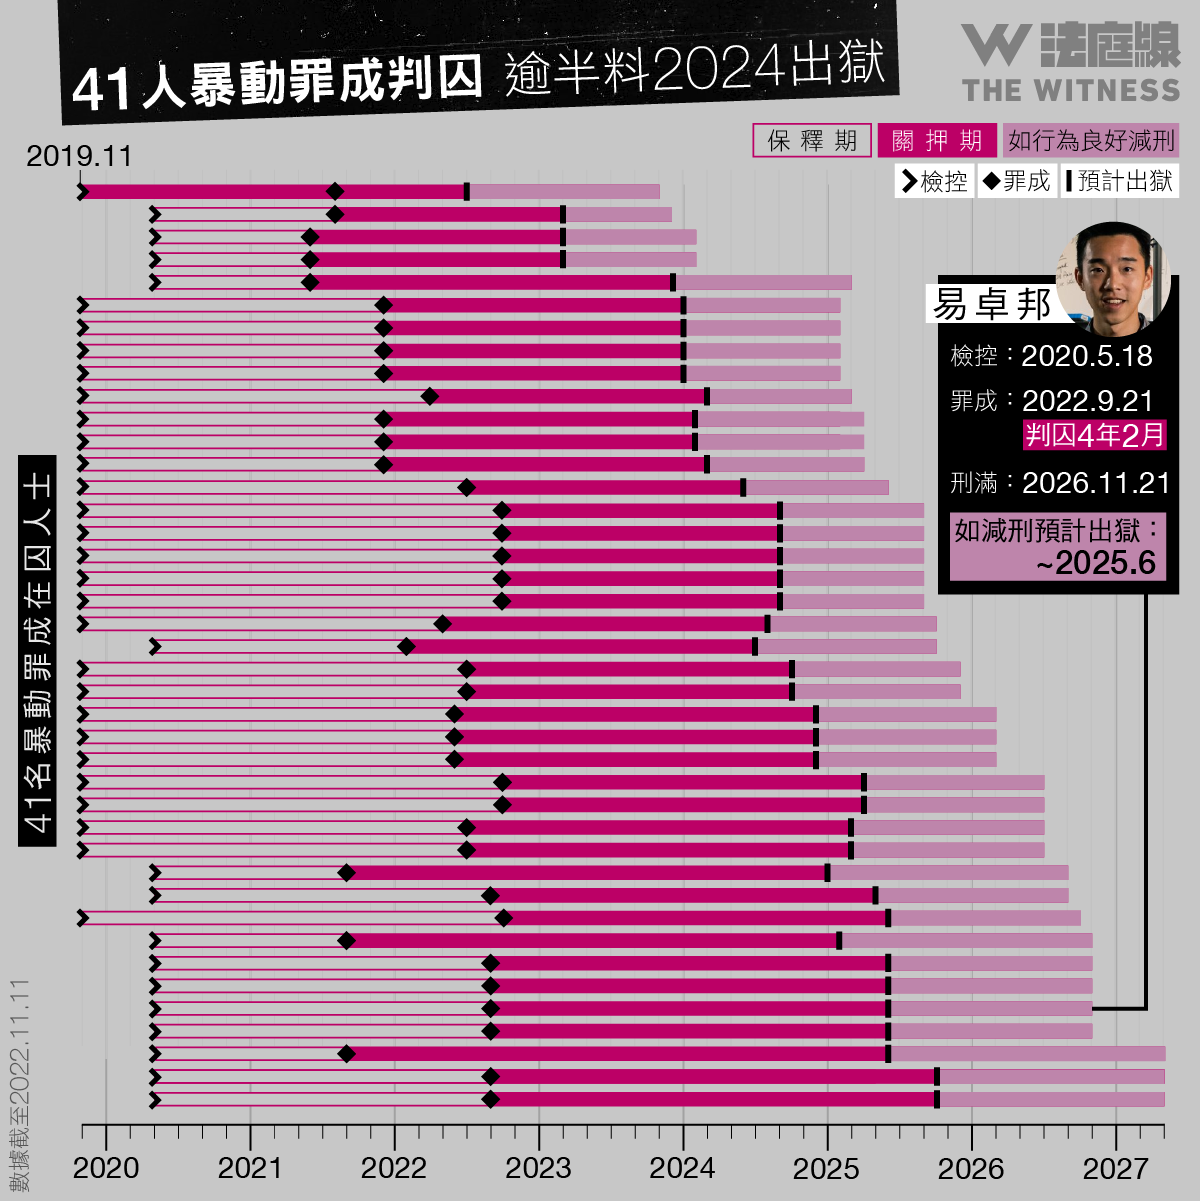
(Right) Temporal Sentencing Timeline: A comprehensive timeline tracking 41 defendants from arrest to projected release. Each horizontal bar represents an individual journey, with specific symbols marking arrest, conviction, and release milestones. Color-coding differentiates between periods of bail, custody, and sentence reduction for good behavior.